
I posted a video on YouTube about plus size sizing, where I showed 4 pairs of jeans, all different sizes that all fit me. I mainly addressed Plus Size sizing in this video, because well I don’t know much (if anything) about straight sizes. After an overwhelming display of comments from straight sized girls saying this was also an issue for them, I decided I wanted to do some investigation. I decided to explore sizing through two stages of analysis:
- Compare various size charts to see what stated variance there was for a sizes between stores
- Compare those measurements to actual products in store and see how much they differed
This is part one of that analysis and will be followed by part two next week. In this part of the investigation I analyzed the actual size charts provided by 12 major straight sized brands and 12 major plus brands. I tried to include several stores that had both plus and straight sized lines to see if there were any unusual differences. Let’s see the results.
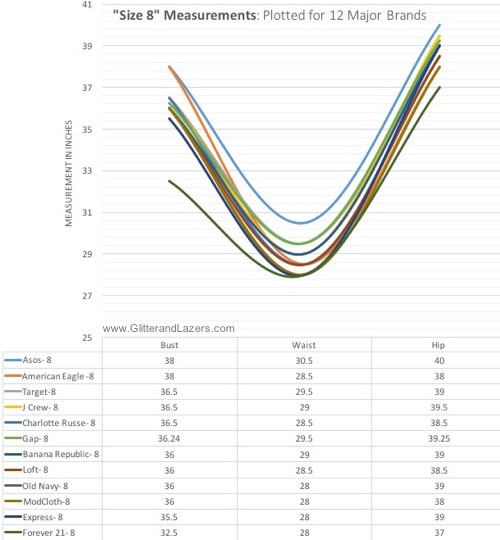
Size 8 size charts plotted for 12 major brands. Data collected Sept 18, 2016
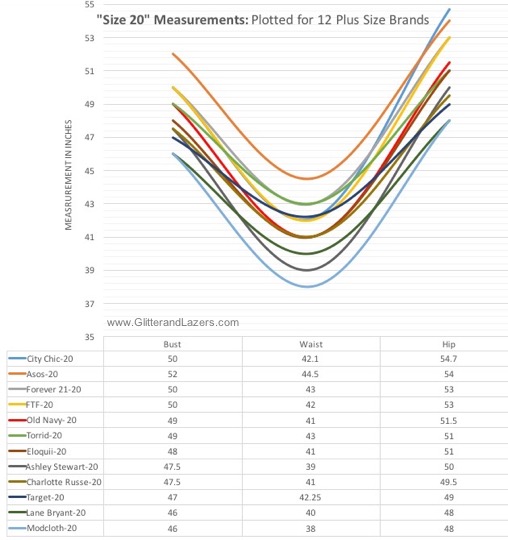
Size 20 size charts plotted for 12 major brands. Data collected Sept 18, 2016
I think it’s fairly easy to see right off the bat, that plus size size charts were significantly more varied when compared with the non-plus sizing. In order to make this difference a little more clear, I created a chart showing just the variance (smallest potential measurement subtracted from the largest) for each size. Plus sizing had a variance of 6,6.5, 6.7 for bust, waist and hips respectfully. The size 8 measurement variance of 5.5, 2.5, 3 for the same areas.
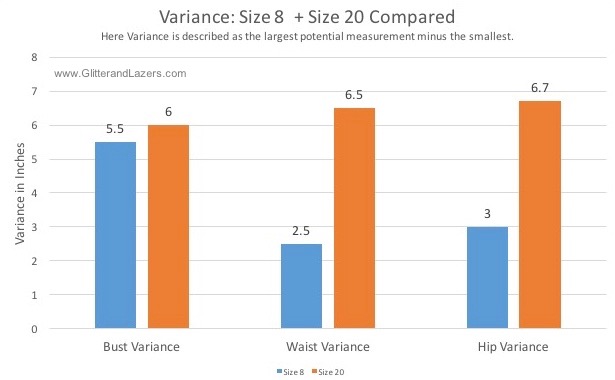
Size 8 + 20 potential variance. Data collected Sept 18, 2016
For straight sizing, the only significant variance is in the bust measurement. This makes sense as some brands are likely targeting a younger, less well- endowed target market. However, the variance is extreme for each of the plus measurements- with the hips toting a nearly 7 inch difference in measurement between the brands with the largest and smallest measurement.

The lowest, highest and average measurement for a size 8 and a size 20. Data collected Sept 18, 2016.
The chart above provides further clarity about a few things about both the size 20 and size 8 variance and helps us better understand why the variance occurs. In the size 8 lines we can see the average lines matches more closely with the high measurement for both bust and hips. On the other hand, we see the average line aligns better with the low line on the waist measurement. What does this mean? In each of the measured category (bust, waist and hips) there is likely one to two brands with outlier measurements. What’s an outlier? It’s basically a fancy numbers way for saying an out of the ordinary occurrence. Like me, I’m probably an outlier. So in short, these outliers creates a greater variance than generally exists in the market place. So in short, thestraight size charts vary much less if we were to remove those pesky outliers (Asos + Forver 21). Plus, and this is just for those super data nerds out there, the median and mode which fell inline with the average, ensuring those pesky outliers were not in fact also skewing the average.
Notice how the average for the plus size brands sits right smack damn in the middle? It’s because the variance is real. When we reference the chart previously shared of each individual brands sizing we can see huge amounts of visual space between every line. The scale of the variance isn’t inflated, it’s the reality.
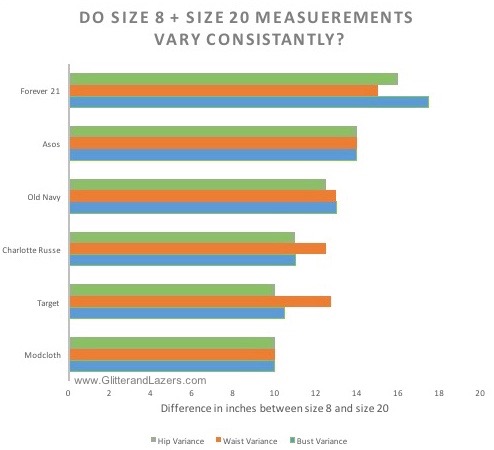
The difference between a size 8 and size 20 in inches for each retailer that offer both plus and straight sized clothes. Data collected Sept 18, 2016.
So then I took a deeper look into the stores that offered both plus and regular lines, how did they compare? Big shocker here but some of the brands had variance that was just too consistent for words. Meaning for plus size clothing they have simply taken a size 8, added a uniform amount of inches to each measurement, and declared it fit for a plus size women. In fashion this practice is called grading. However past a size 8 plus women do not gain weight uniformly, so grading a size 8 to a 20? That’s kind of a no-no. Most plus brands use size 18 fit models to establish sizing, so they are grading the product from a size relatively close to the actual wearer. Asos, Old Navy, and Modcloth while I love your designs, grading a size 8 to a size 20 isn’t just ridiculous, it’s disappointing.
So what does this mean? Plus size clothing is designed with a greater scale of variance than straight size clothing. Some of this variance may be a result of brands who offer both plus and straight size clothing grading up, instead of fitting and sizing off of a plus model’s measurements.
However what remains to be seen is if this variance is actually translated into the physical clothes themselves. How consistently are clothes made against these measurements? Do these size charts really hold up? There are so many interesting and valuable questions left unanswered. So this weekend I am going to the mall to hand measure several size 8s and size 20s from a few retailers. And I’ll analyze those measurements to see how they stack up against sizing charts. I’ll share the methodology, process and results of that analysis next Monday. I have this sneaky feeling that these measurements are going to explain the real reason why every body is frustrated about sizing when buying clothes.
This is an amazing and informative amount of work. Thank you so much for talking to time to do this. What a wonderful tool! I’ll use that first chart to help me order clothes!
I really appreciate you taking the time to do this- for both straight and plus sizes. This will really help me order online as I live in the sticks with little to choose from.